Live Occupancy
How many people are inside each location right now, rising and falling as they walk in and out. Occupancy against capacity, per site, at a glance.

Overview, live occupancy, trends, zones, conversion, reports and device health — in the browser, nothing to install, on any screen.
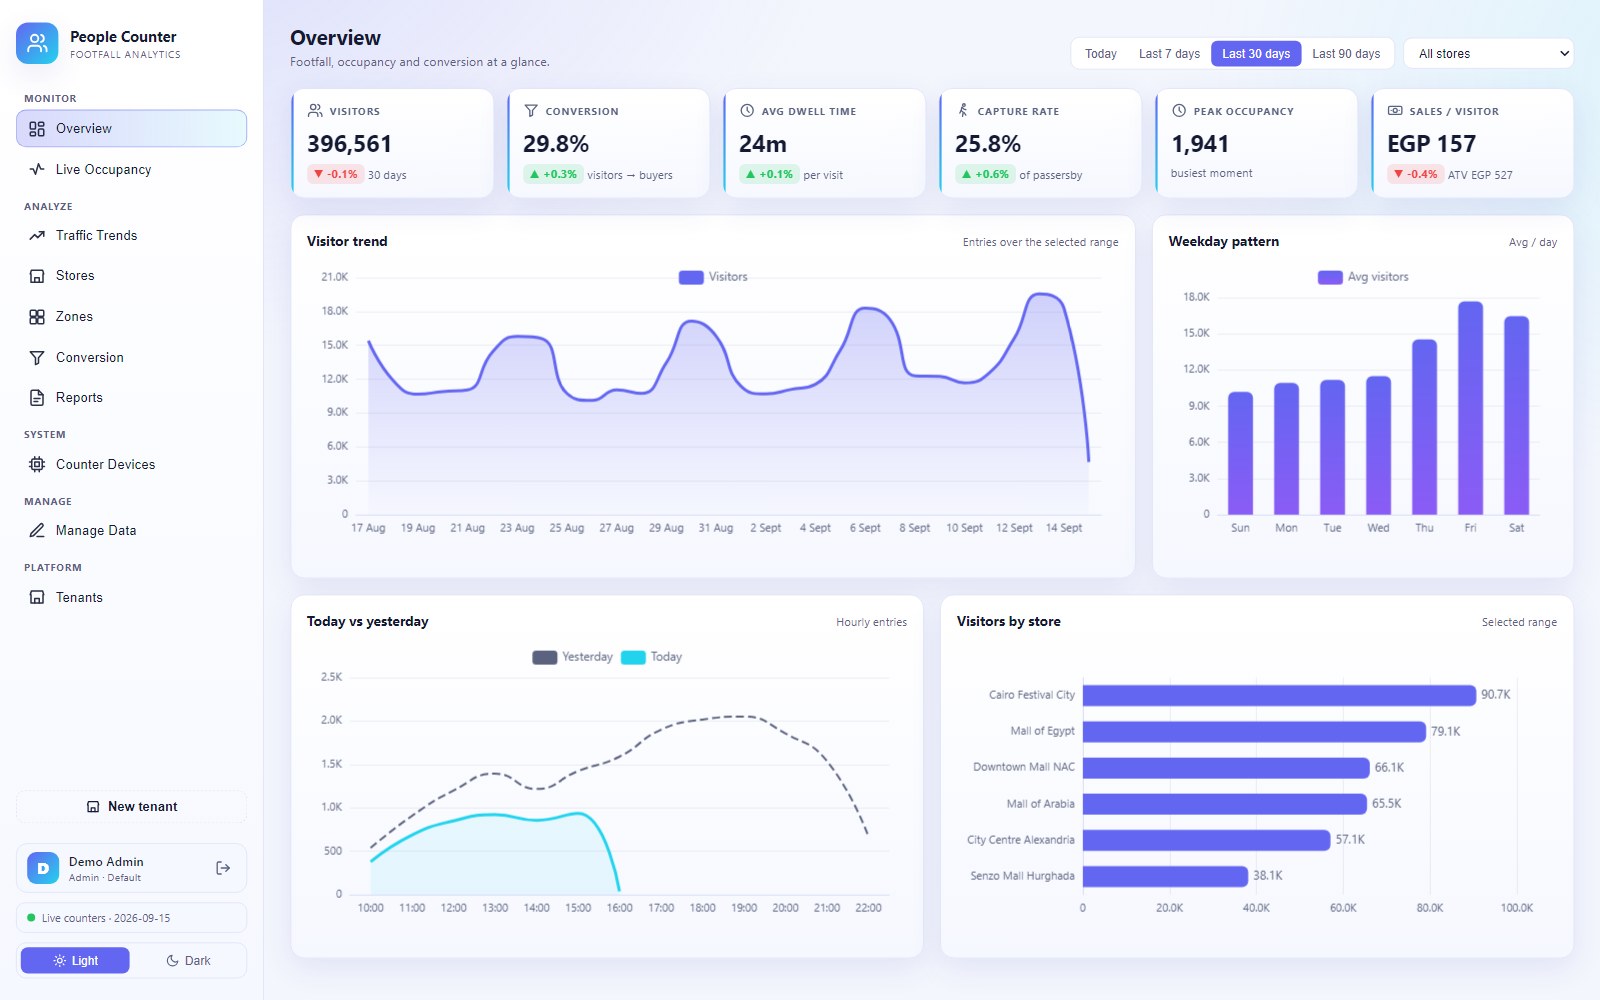
Everything listed here is live and in use. Nothing on this page is a roadmap item.
How many people are inside each location right now, rising and falling as they walk in and out. Occupancy against capacity, per site, at a glance.
Visitor trends across any range, an average-per-day marker, an hourly profile, and a weekday × hour heatmap that makes your busy windows obvious.
Every location side by side — footfall, capacity use and performance — so the outlier stands out without building a spreadsheet.
Traffic distribution between zones inside a single site. Which entrance, which floor, which gallery.
Passersby → visitors → transactions, with capture rate and conversion rate. Upload POS figures and the funnel completes itself.
Build a report, narrow it to the hours that trade, and export to Excel or CSV for whoever wants a file.
Accuracy, uptime and last-seen for every sensor, so a unit that stopped counting is visible immediately instead of at month end.
One account, many sites. Separate data per organisation, with admin and viewer roles for the people who should only read.
Daily visitors against your average, the shape of an average day, and a weekday × hour heatmap of the whole period.
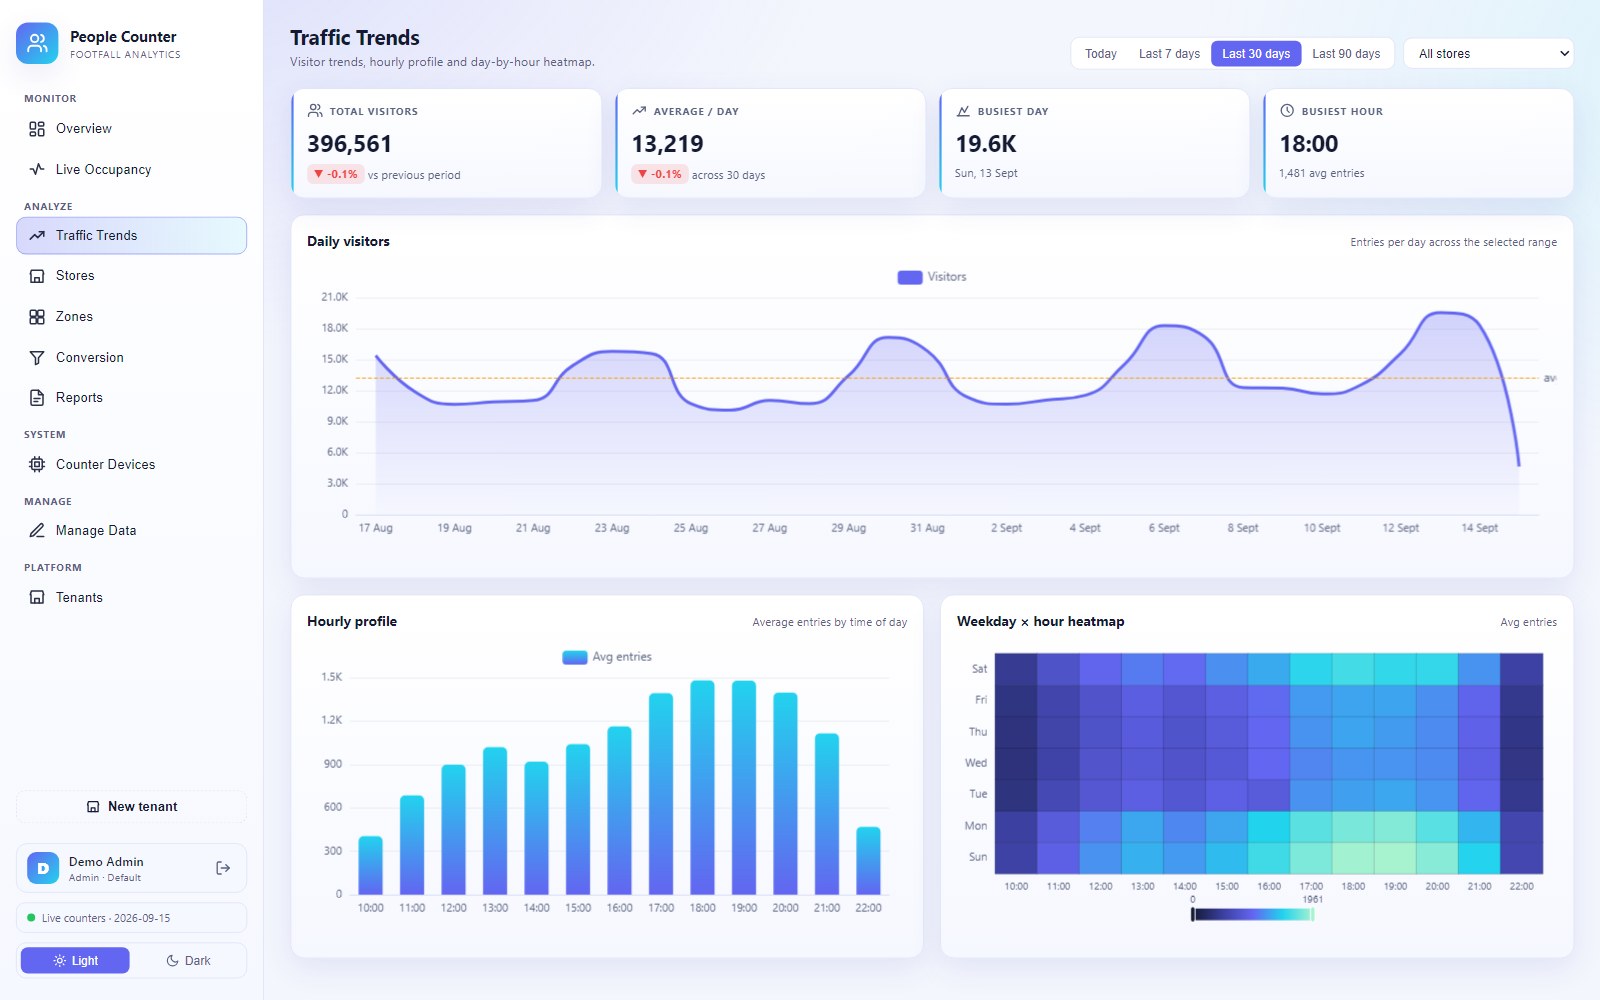
Sign in if you already have an account, or talk to us about connecting your first sensor.