Live Occupancy
How many people are inside each location right now, updating as they walk in and out.

Pcountr turns the sensor above your door into decisions — live occupancy, hourly trends and conversion for every location, in one cloud dashboard and one open API.
Cloud dashboard · Open REST API · Multi-location · Retail, malls, museums, transit
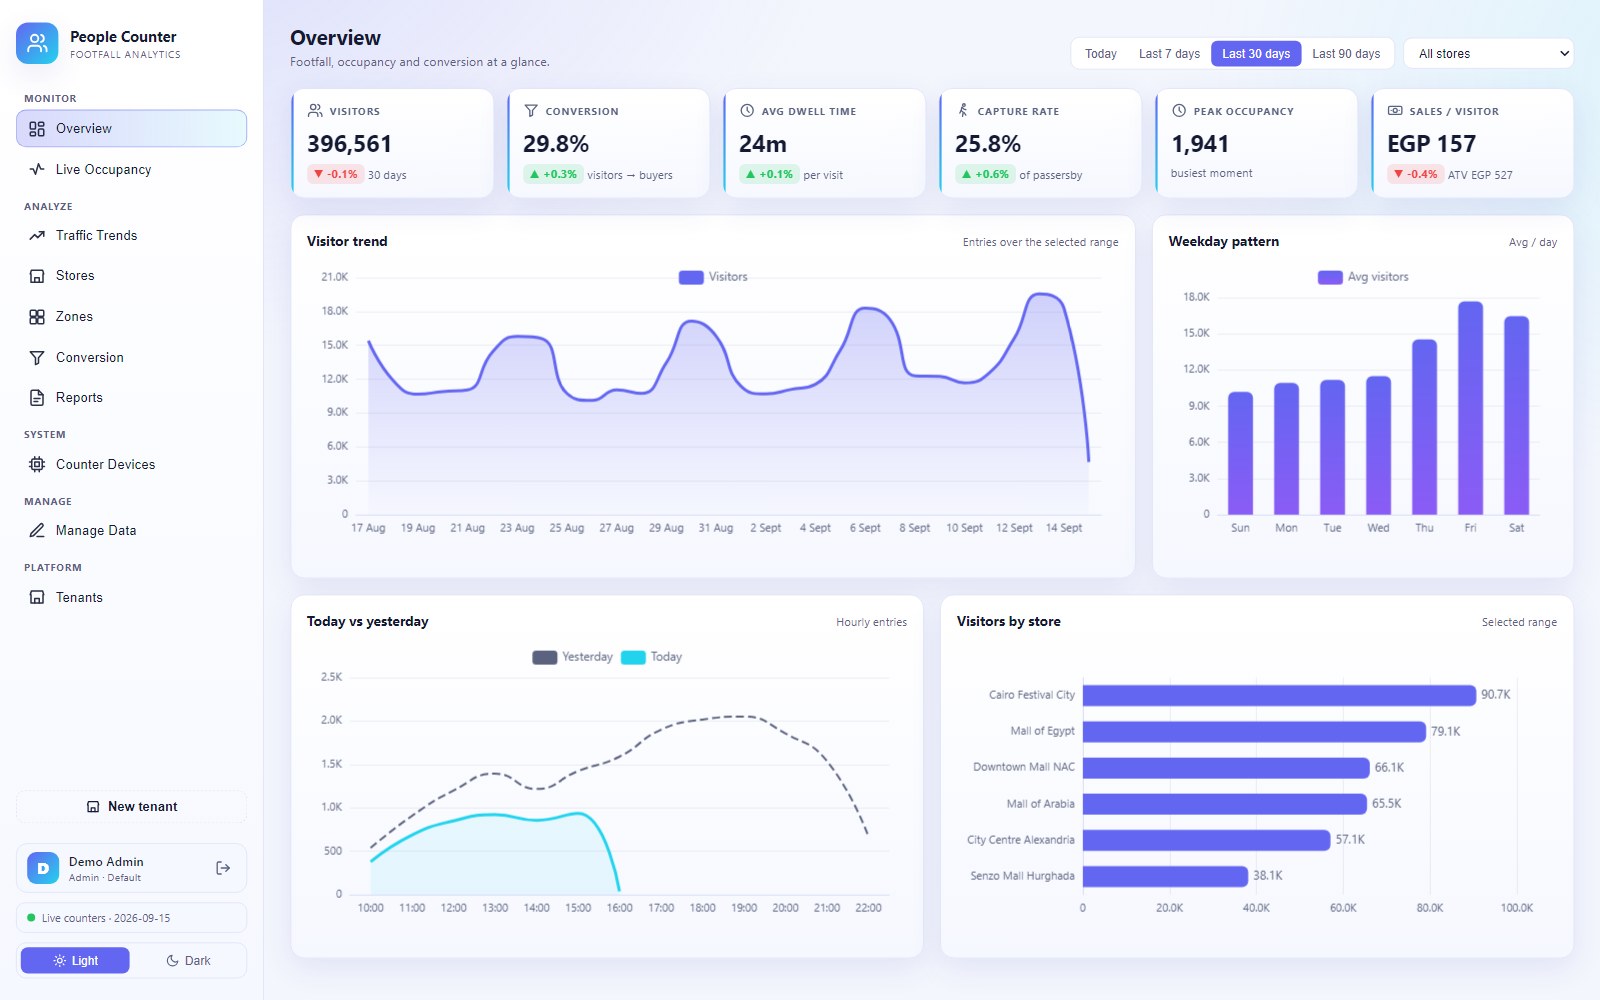
Six of the screens your team will live in. All of it in the browser, nothing to install.
How many people are inside each location right now, updating as they walk in and out.
Visitor trends over time, an hourly profile, and a weekday × hour heatmap showing exactly when you are busy.
Footfall, capacity use and performance side by side across every location you run.
Passersby → visitors → transactions, with capture and conversion rates per store.
Build store reports and export them to Excel or CSV for the people who want a spreadsheet.
Accuracy, uptime and last-seen for every counter sensor, so a dead unit never goes unnoticed.
A 3D sensor over the entrance counts people in and out, in five-minute intervals.
The sensor uploads its counts to Pcountr automatically, over FTP or HTTP push.
Counts land in your warehouse and appear in the dashboard by store, day and hour.
Pull the same numbers into your ERP, BI or CRM with a single REST call.
Store performance and staff scheduling from measured traffic, not guesswork.
Tenant analytics and lease conversations backed by numbers both sides trust.
Visitor flow and capacity planning across galleries and timed entry.
Passenger flow and queue management where minutes matter.
Occupancy monitoring and space utilisation for the floors you pay for.
White-label deployment and API integration for your own clients.
Every figure in the dashboard is available over a plain REST call — one key per tenant, JSON out. Put footfall next to revenue in the system your team already uses.
# daily totals per store
curl -H "Authorization: Bearer <your_api_key>" \
  "https://app.pcountr.com/api/daily?from=2026-09-01&to=2026-09-15"

[ { "date": "2026-09-01", "siteId": "118",
    "visitors": 303, "exits": 329, "peakHour": 17 } ]
Already a customer? Sign in to your dashboard. New to Pcountr? Tell us about your sites and we will show you what the data looks like.